Graphical Lasso 1
Graphical Lasso
A. Covariance Matrix
The covariance matrix measure how multiple variables vary together. It is a square matrix, symmetric, with size determined by the number of variables you have. If you have a vector of random variables , the covariance matrix is defined as:
- Diagonal elements: variances
- Off-diagonal elements: covariances , which indicate how two variables change together:
- Positive covariance indicates variables tend to increase or decrease together.
- Negative covariance indicates variables tend to vary in opposite directions.
- Zero covariance indicates no linear relationship between variables(doesn’t imply independence)
B. Precision Matrix():
Precision matrix is simply the inverse of the covariance matrix and is written as:
- Diagonal elements give an idea about the variance of each variable conditional on all other variables.
- Off-diagonal zeros indicate conditional independence. Specifically:
- means variable and are conditionally independent given all the other variables.
- Thus, precision matrix is very useful in graphical models because it reveals conditional independence structure clearly.
C. Empirical Covariance Matrix S
The empirical covariance(sample covariance matrix) is an estimate of the true covariance matrix based on your actual data. For an observational dataset of (n) samples and (p) variables, your data matrix is:
It assumes your data is centred(mean-subtracted), empirical covariance matrix is computed as:
This empirical covariance matrix is our practical tool to infer the covariance structure since the true covariance matrix of whole population is generally unknown.
Graphical Models and Graphical Lasso
A. Gaussian Graphical Model(GGM):
A GGM assumes your multi-dimensional data vector is from a multivariate Gaussian distribution:
The structure of conditional dependence is captured by the precision matrix:
- implies conditional independence of the corresponding variables given the others.
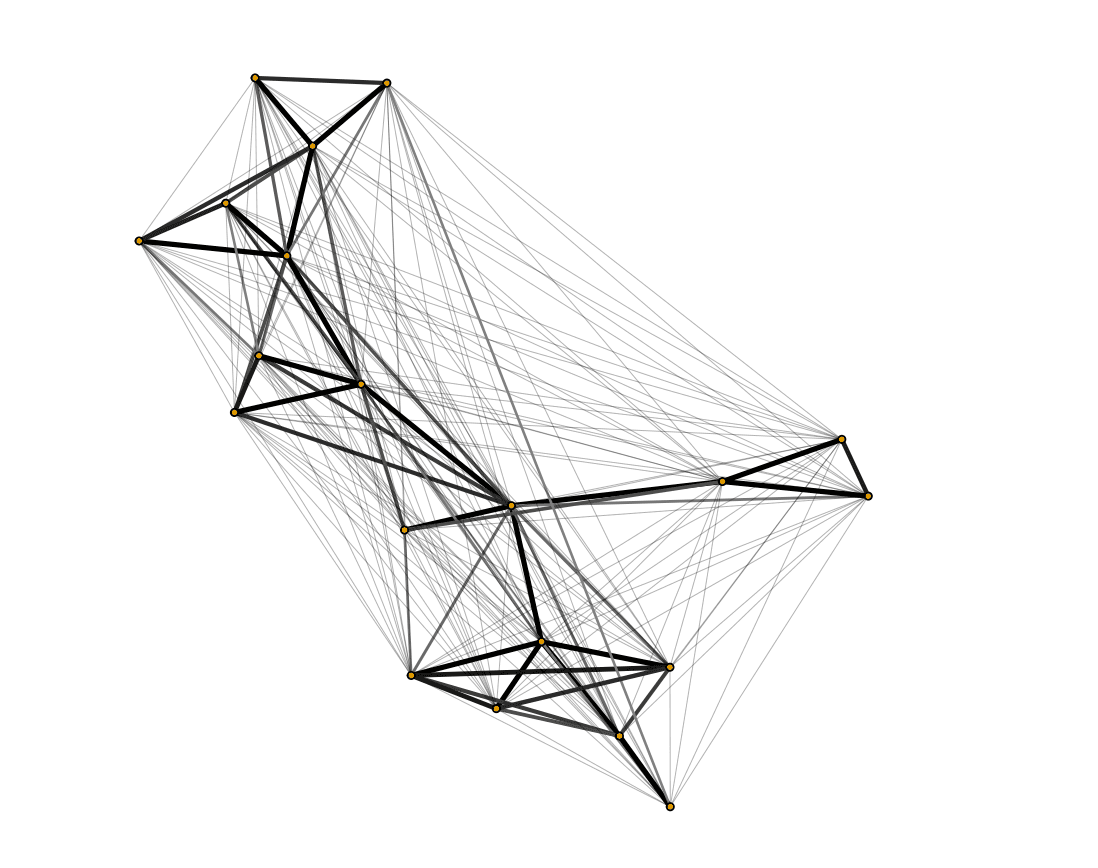
- Each non-zero entry represents a conditional dependency. This means the precision matrix defines a graphical model(network), where nodes represent variables and edges represent conditional dependencies.
Thus, the main objective of graphical modelling is estimating , which reveals conditional independencies.
B. Graphical Lasso:
The graphical lasso(glasso) is an estimator that simultaneously estimates the precision matrix and provides sparsity(many zeros), simplify the graphical structure. Graphical Lasso solves the following optimization problem:
- ensures is positive definite.
- relates directly to Maximum Likelihood from the Gaussian distribution assumption.
- imposes an L1 penalty(lasso penalty) which induces sparsity. A larger value results in more zeros(sparser) in the precision matrix.
This L1 penalty makes graphical lasso valuable compared to simple precision estimations, specialising in interpolation, dimension reduction, and providing useful graphical network.
Graphical Lasso
A. Covariance Matrix
The covariance matrix measure how multiple variables vary together. It is a square matrix, symmetric, with size determined by the number of variables you have. If you have a vector of random variables , the covariance matrix is defined as:
- Diagonal elements: variances
- Off-diagonal elements: covariances , which indicate how two variables change together:
- Positive covariance indicates variables tend to increase or decrease together.
- Negative covariance indicates variables tend to vary in opposite directions.
- Zero covariance indicates no linear relationship between variables(doesn’t imply independence)
B. Precision Matrix():
Precision matrix is simply the inverse of the covariance matrix and is written as:
- Diagonal elements give an idea about the variance of each variable conditional on all other variables.
- Off-diagonal zeros indicate conditional independence. Specifically:
- means variable and are conditionally independent given all the other variables.
- Thus, precision matrix is very useful in graphical models because it reveals conditional independence structure clearly.
C. Empirical Covariance Matrix S
The empirical covariance(sample covariance matrix) is an estimate of the true covariance matrix based on your actual data. For an observational dataset of (n) samples and (p) variables, your data matrix is:
It assumes your data is centred(mean-subtracted), empirical covariance matrix is computed as:
This empirical covariance matrix is our practical tool to infer the covariance structure since the true covariance matrix of whole population is generally unknown.
Graphical Models and Graphical Lasso
A. Gaussian Graphical Model(GGM):
A GGM assumes your multi-dimensional data vector is from a multivariate Gaussian distribution:
The structure of conditional dependence is captured by the precision matrix:
- implies conditional independence of the corresponding variables given the others.
- Each non-zero entry represents a conditional dependency. This means the precision matrix defines a graphical model(network), where nodes represent variables and edges represent conditional dependencies.
Thus, the main objective of graphical modelling is estimating , which reveals conditional independencies.
B. Graphical Lasso:
The graphical lasso(glasso) is an estimator that simultaneously estimates the precision matrix and provides sparsity(many zeros), simplify the graphical structure. Graphical Lasso solves the following optimization problem:
- ensures is positive definite.
- relates directly to Maximum Likelihood from the Gaussian distribution assumption.
- imposes an L1 penalty(lasso penalty) which induces sparsity. A larger value results in more zeros(sparser) in the precision matrix.
This L1 penalty makes graphical lasso valuable compared to simple precision estimations, specialising in interpolation, dimension reduction, and providing useful graphical network.